Gallery
|
|

|
|
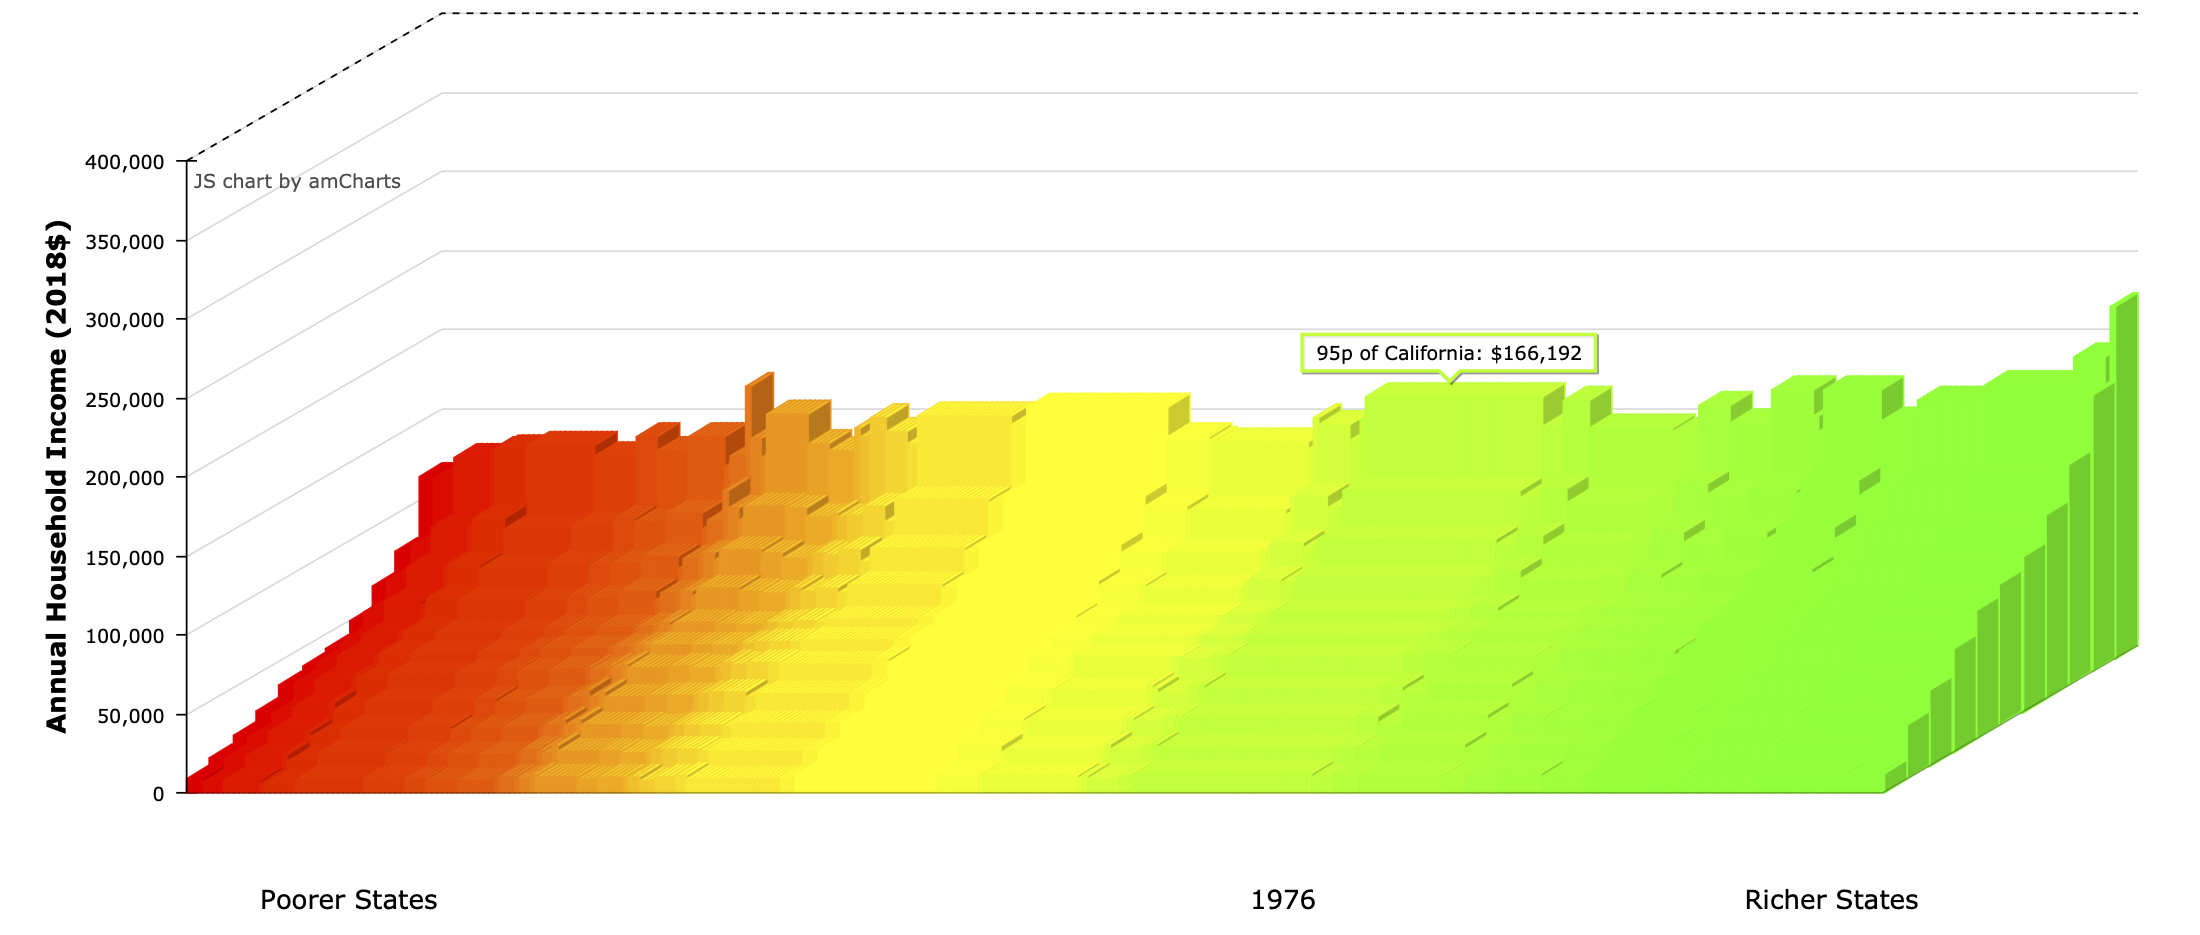
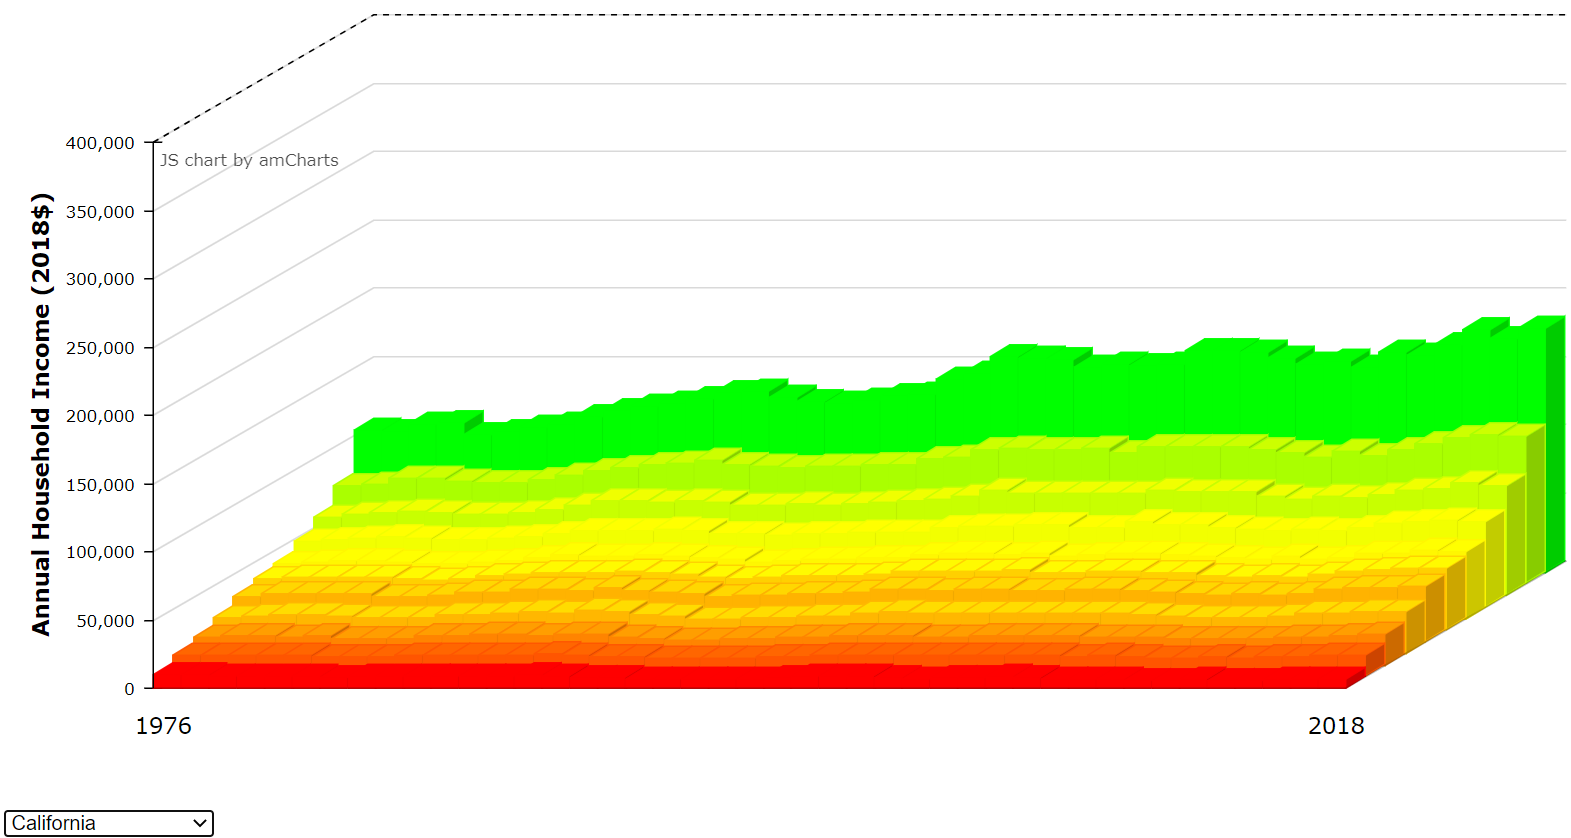
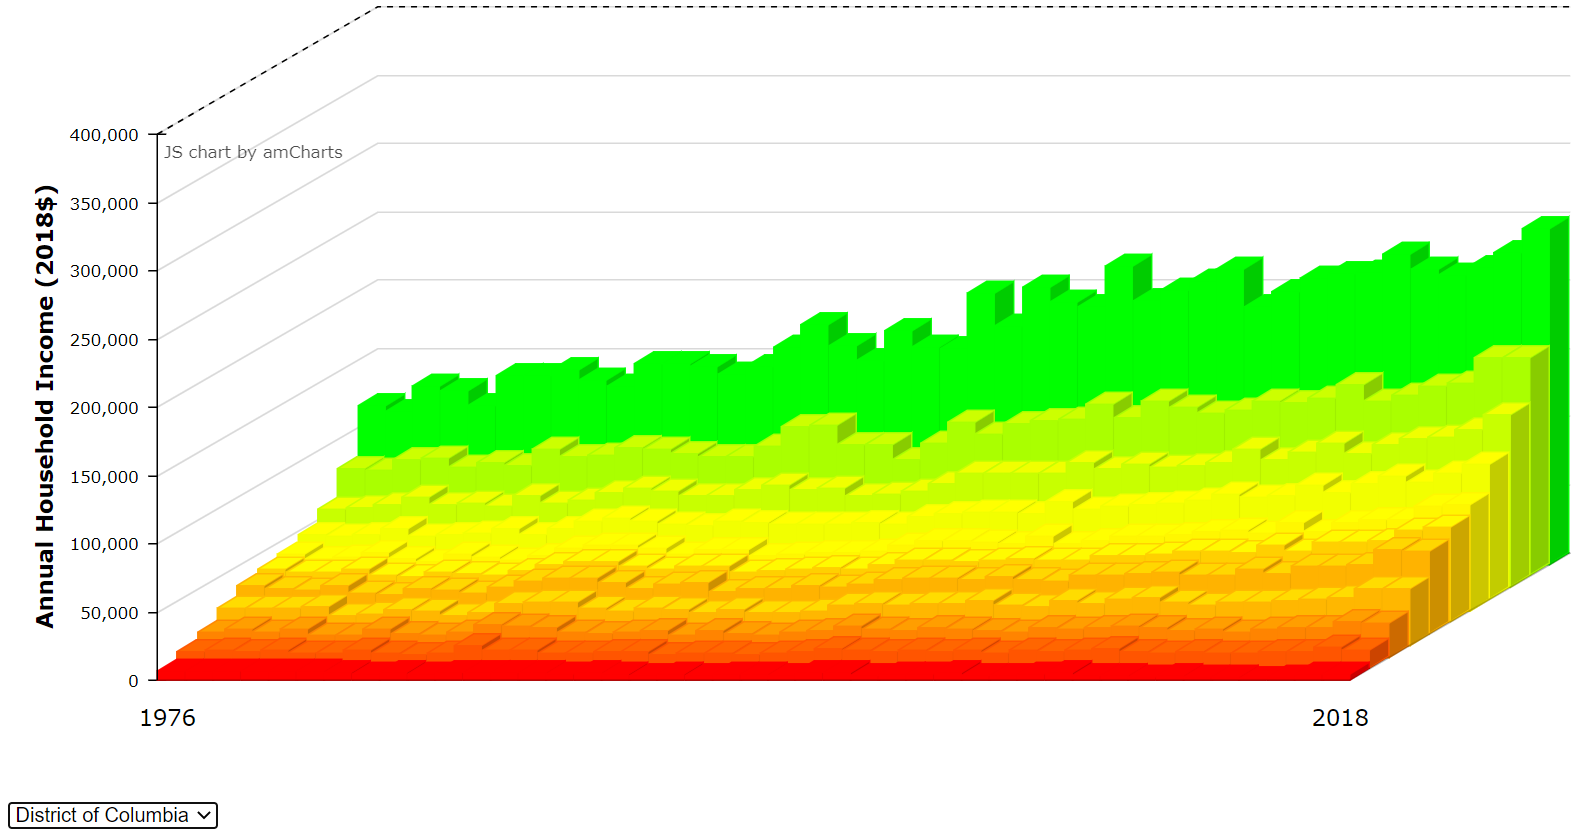
Interactive graph (top) and dynamic graph (bottom) is implement in JavaScript AmChart and Python Matplotlib, respectively. More instant examples of interactive graphs can be found at research.depauw.edu/econ/incomevis. Animated graphs with better control can be generated in a (preferably local) Python environment (for example, see this notebook.).
4 levels of deflating income.
|
|
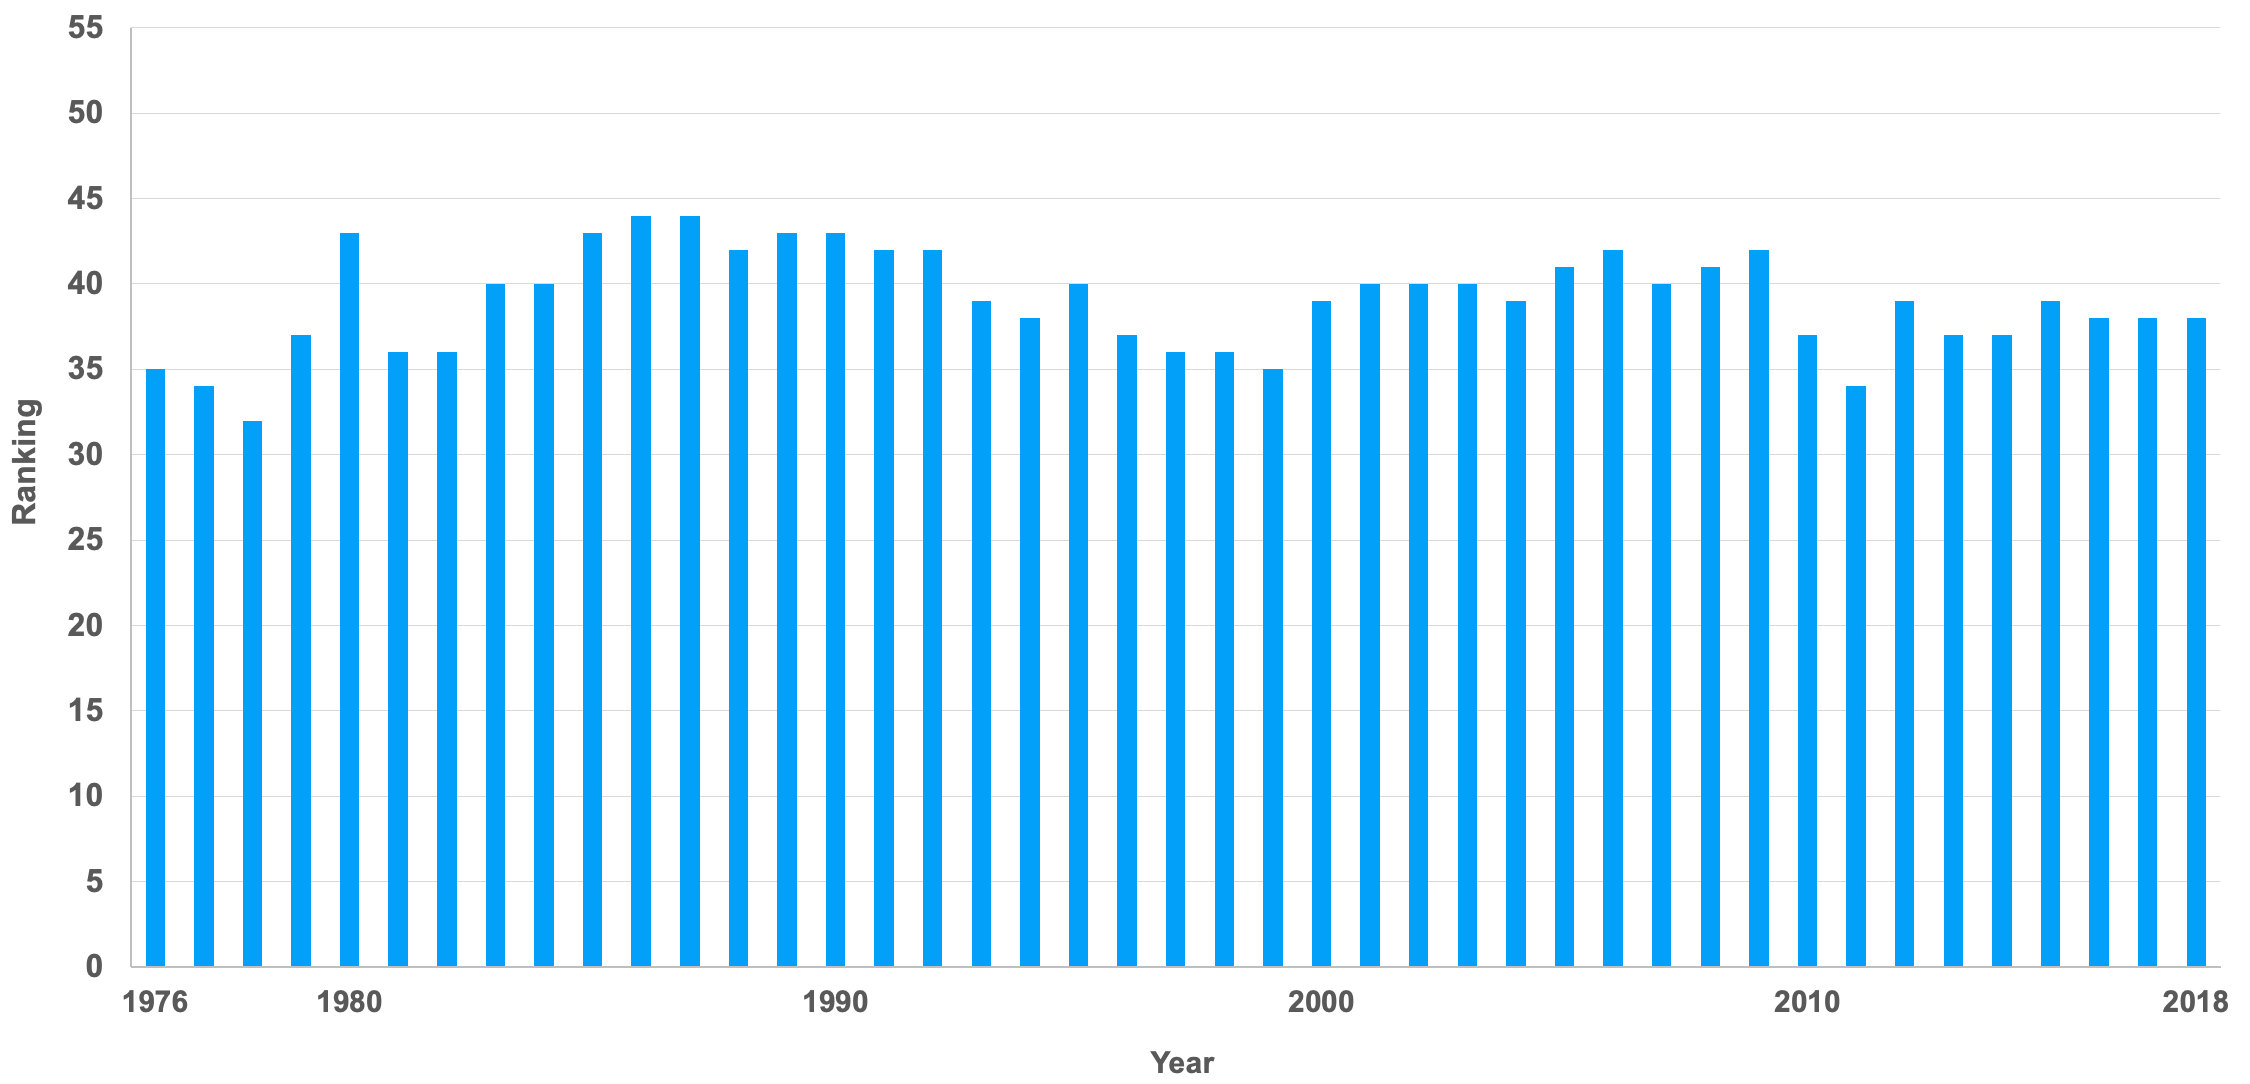
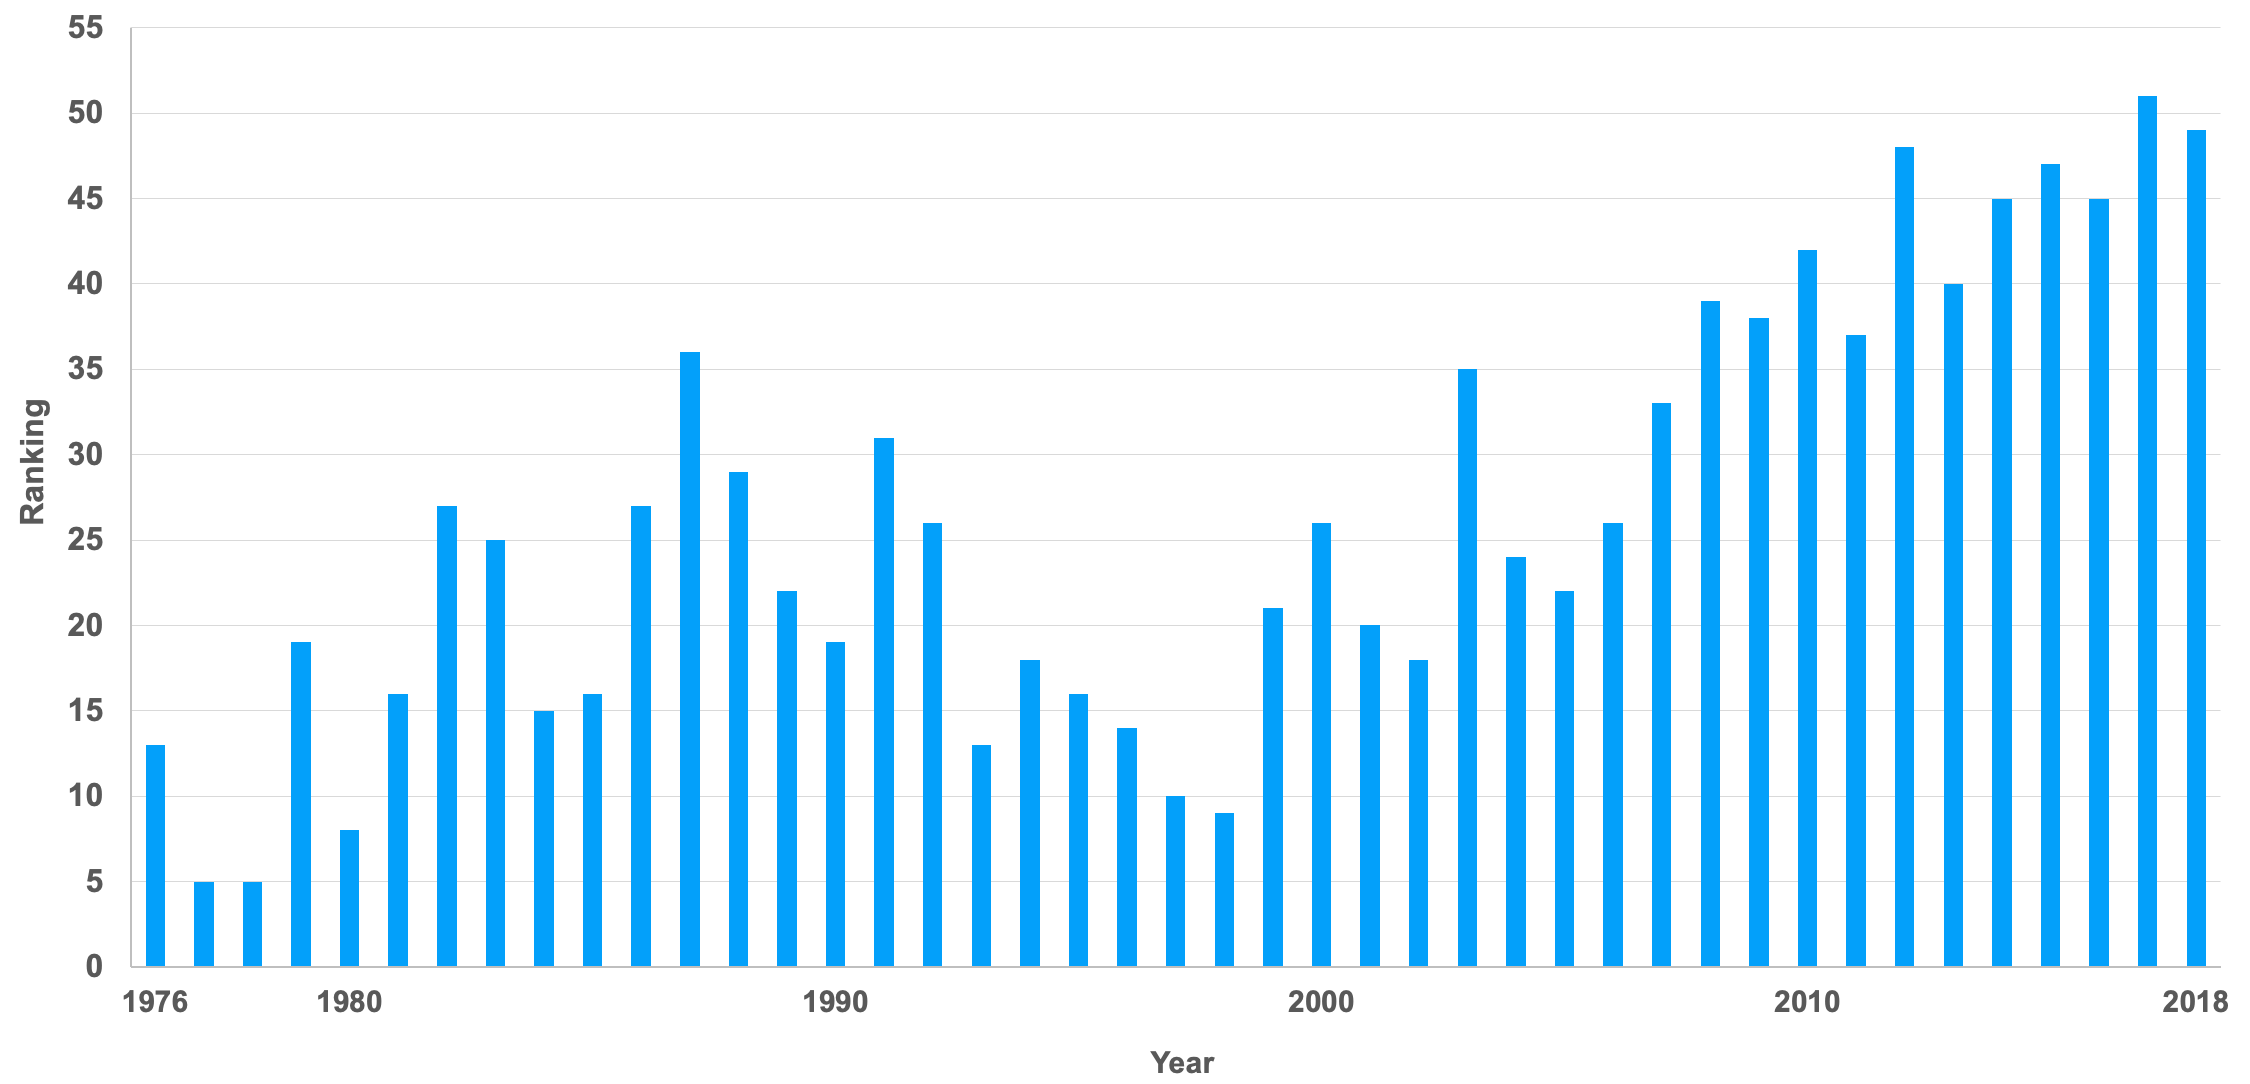
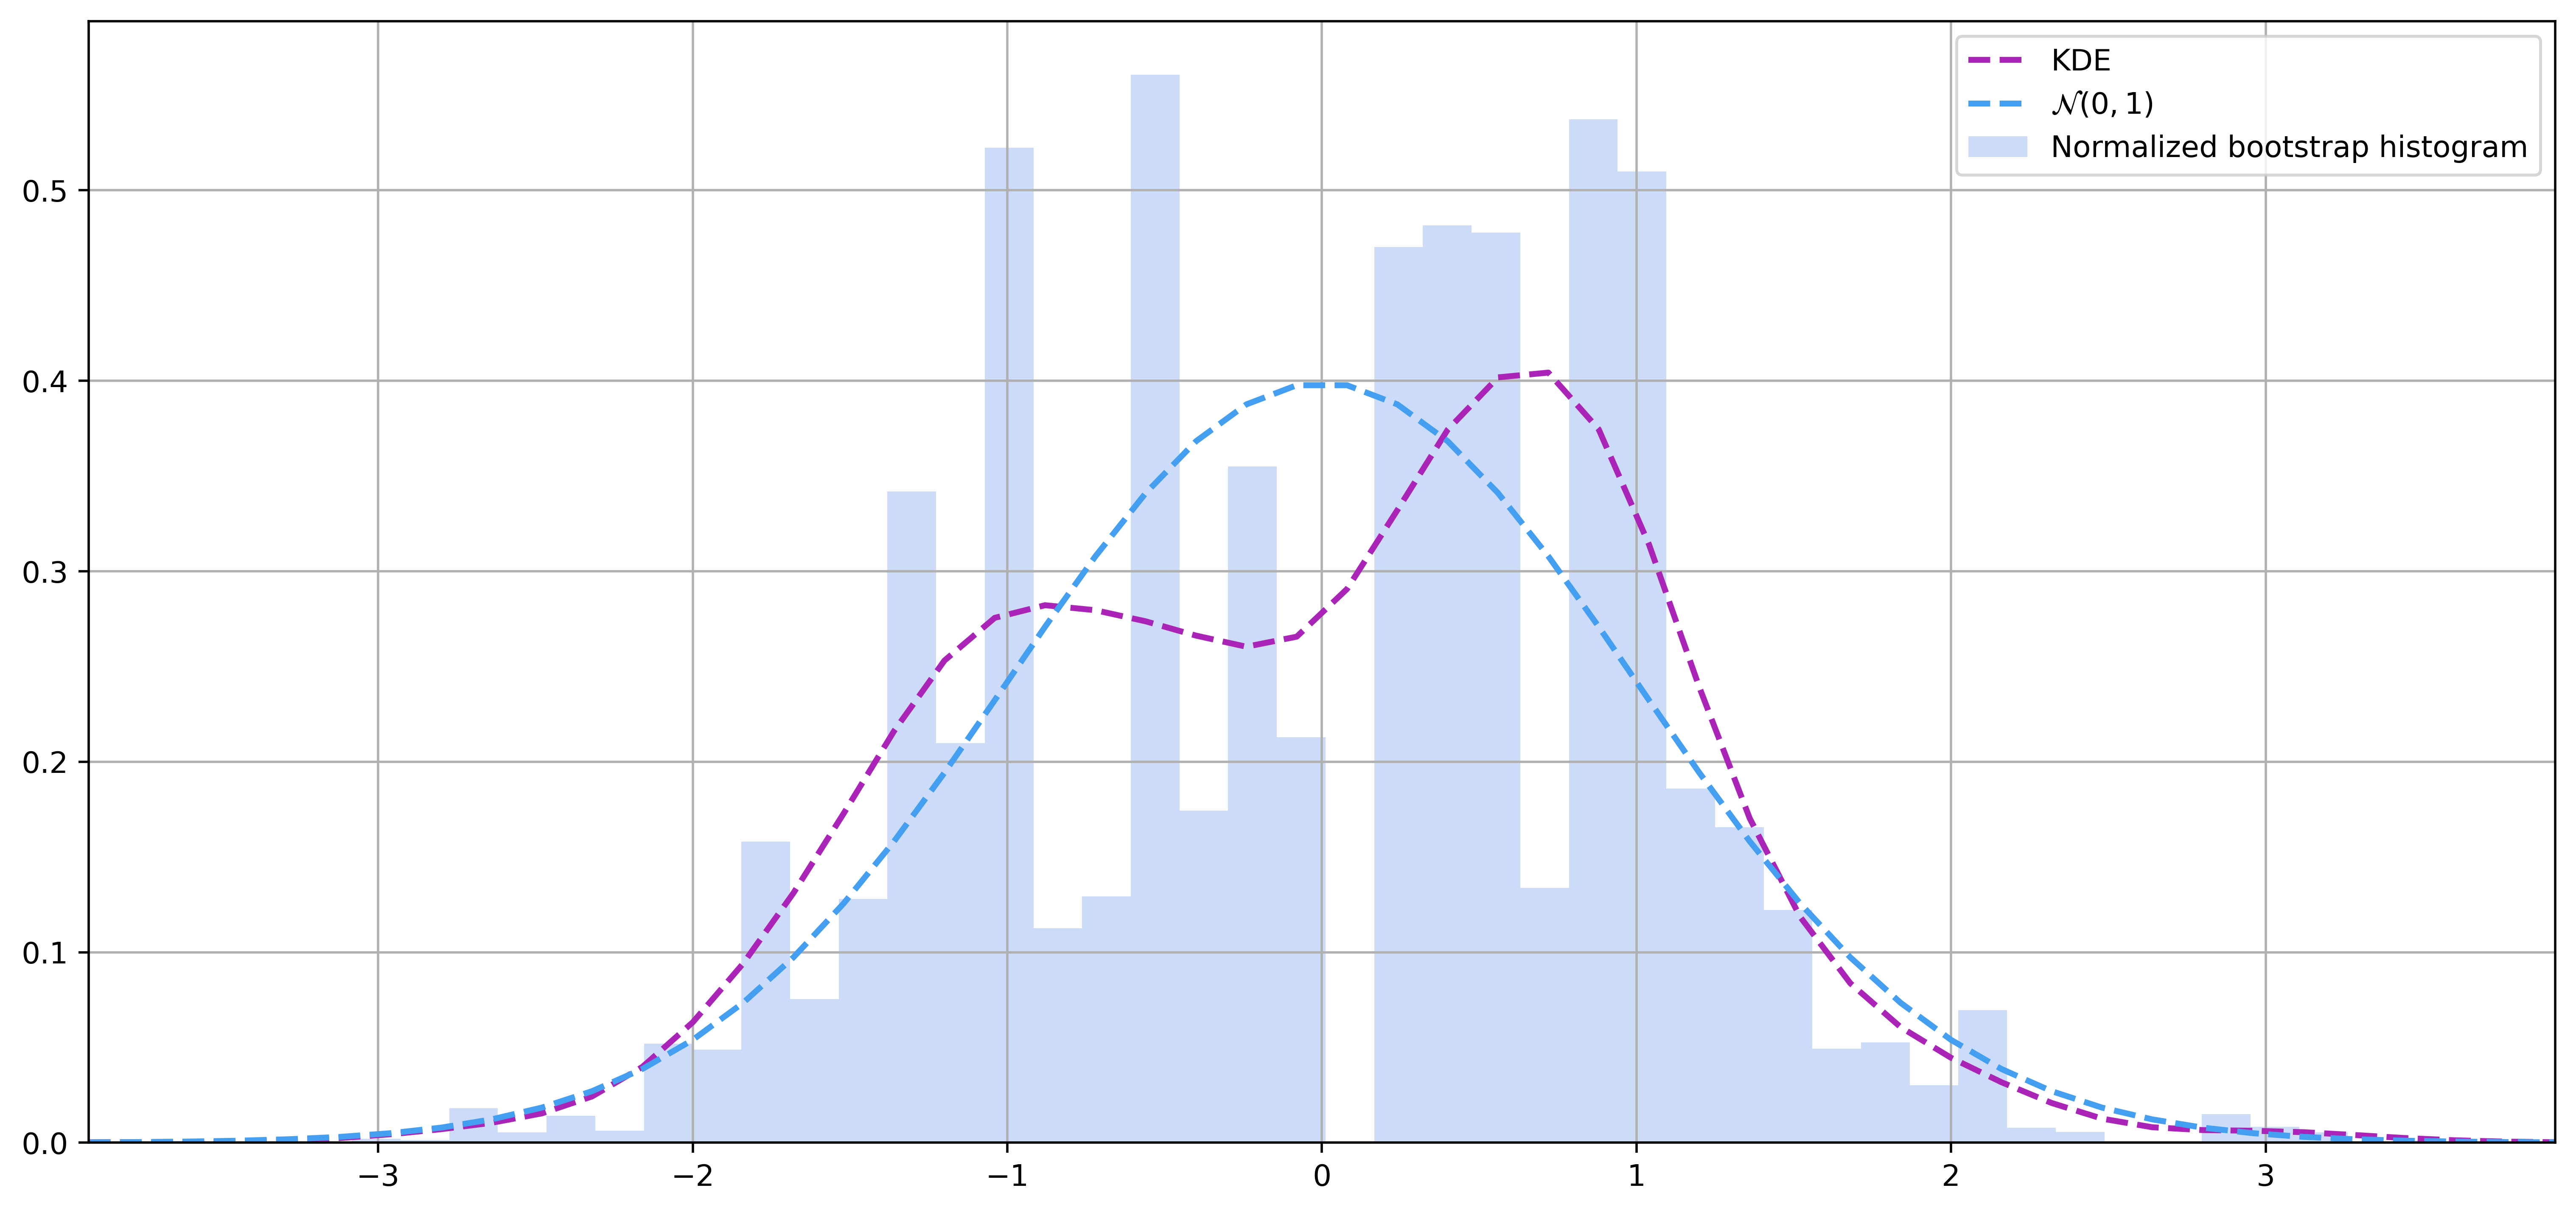
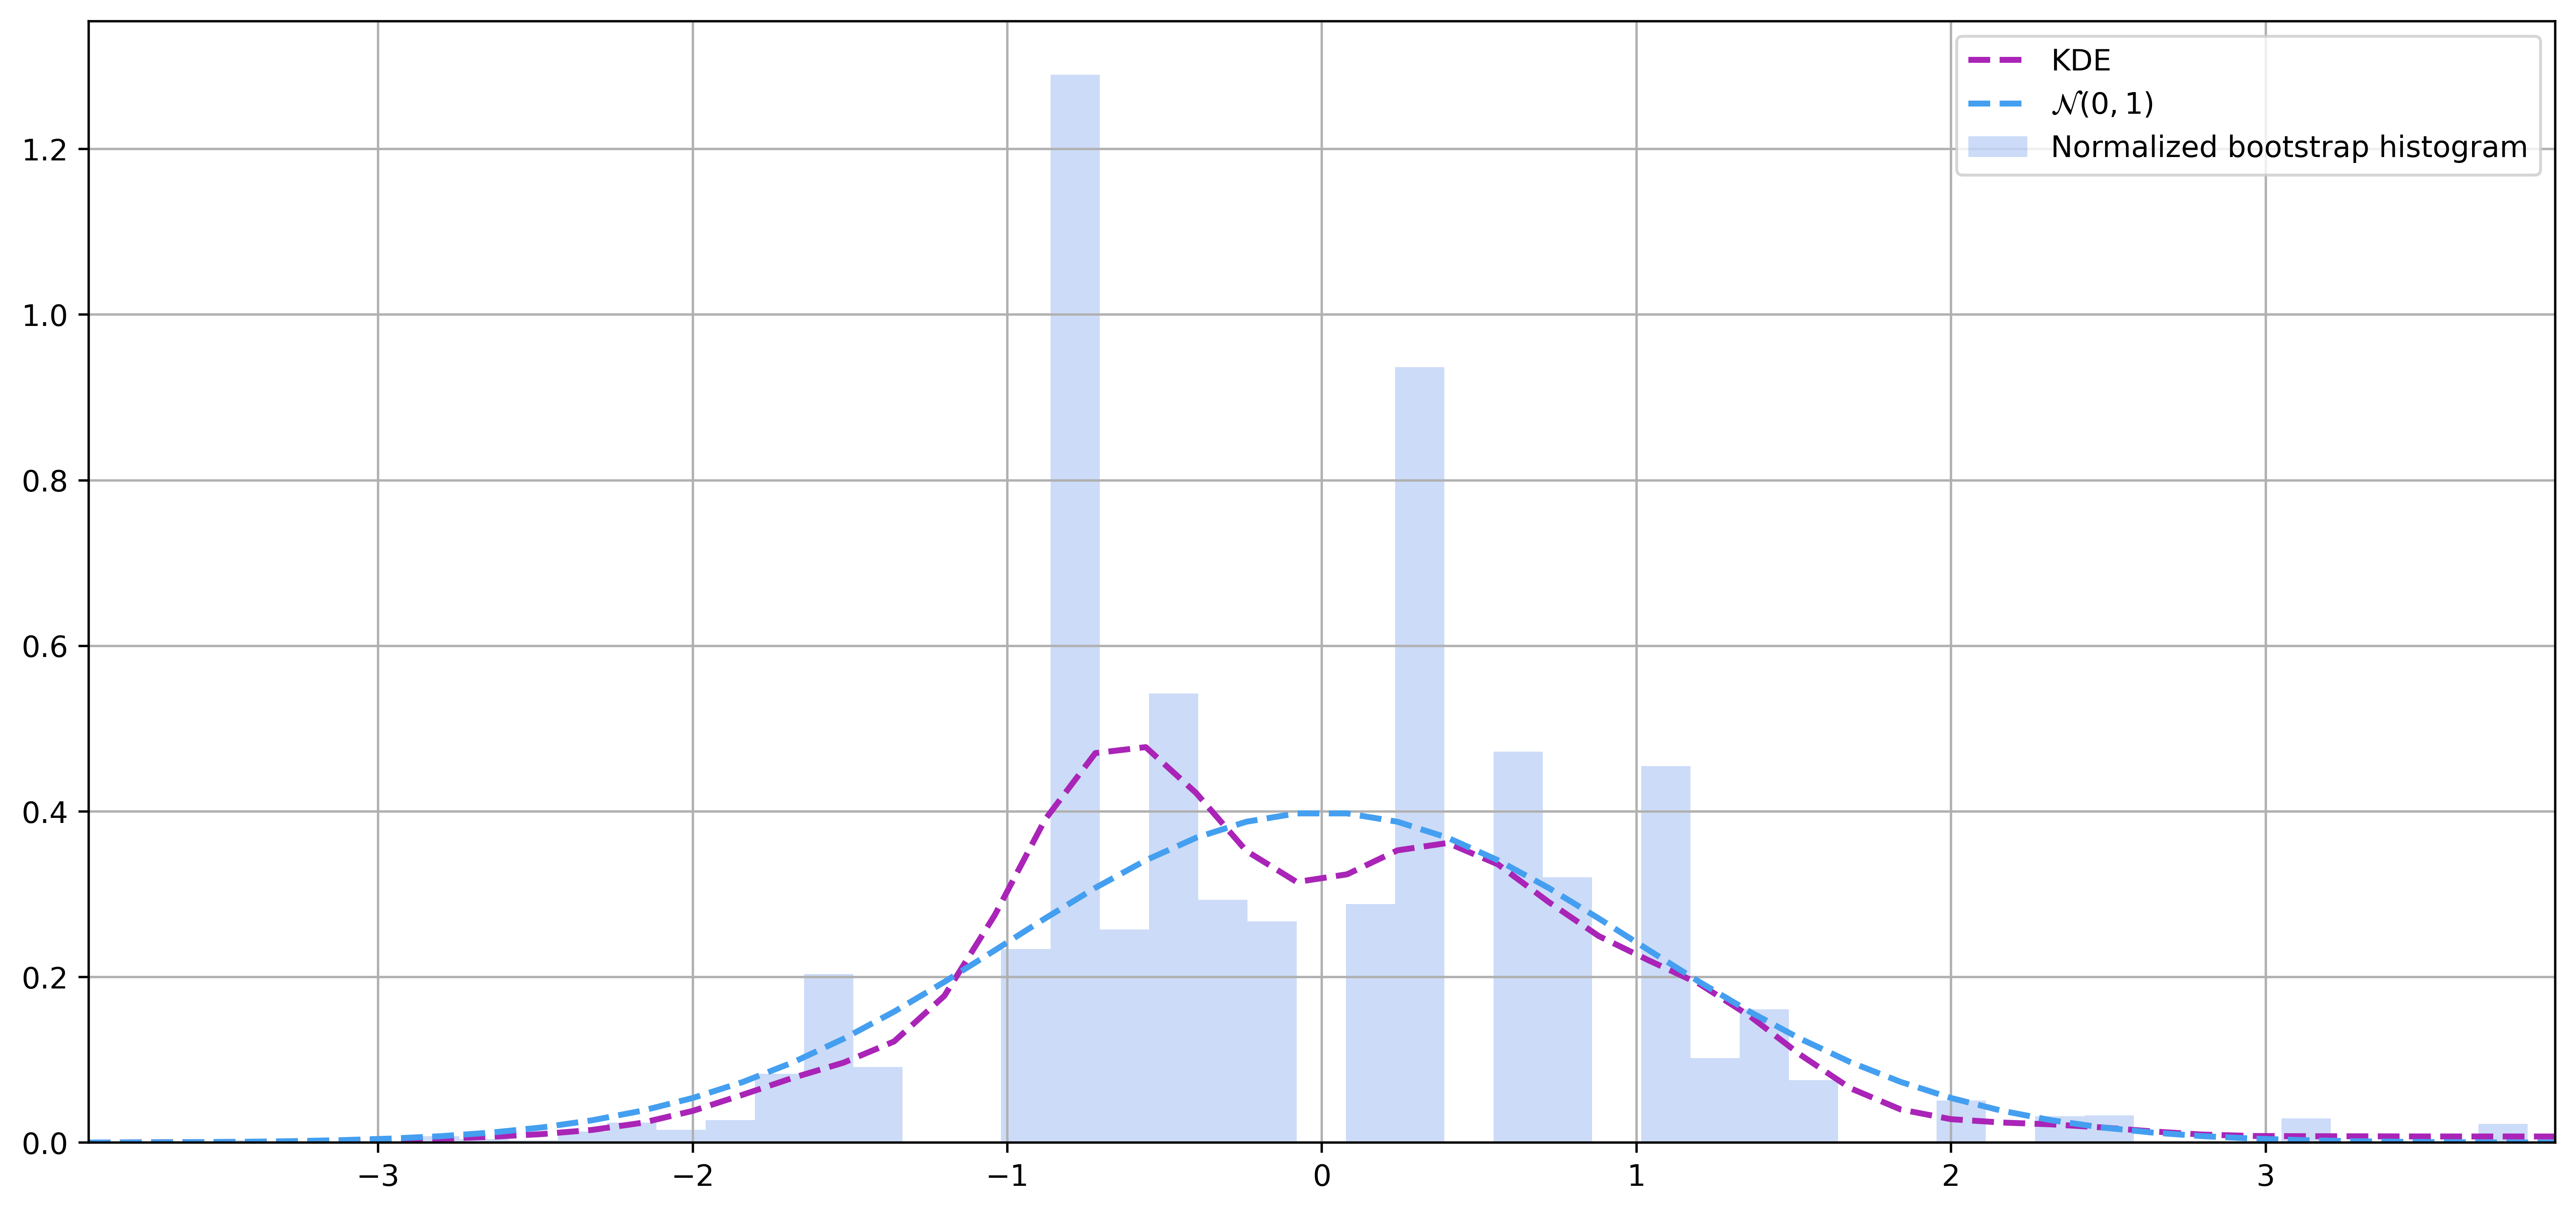
Bellow are bootstrap resampling of 50p of DC in 1977 10000 times (bottom right) and 1 million times (bottom left). We also show the relative growth of CA and DC overtime.
|
|
|
|
A completed and separated page for gallery will be available soon!